Demo Test Suit package and Python API bindings updated

Changelog:

Release “1.0-alpha” (2014-07-11)

  • Added Crawler URL normalization.
  • Added Crawler API results merging from N nodes.
  • Added Crawler incremental sites crawling.
  • Added Crawler additional support of structure formats.
  • Added Processor improvements of basic and predefined templates for scraping.
  • Added run-time change of logging level and polling timeouts.
  • Complete updated integration and deployment for Debian OS.
  • Complete updated main networking and crawling engine.
  • and many more…

HCE-node updated to v1.2-3

Changelog:

Release 1.2-3 (2014-06-06)

  • Added DRCE new functionality of support of set of new requests types.
  • Added DRCE new functionality of support of tasks state callback notification.
  • Added DRCE new functionality of support of POCO logger with rotation.
  • Added DRCE new functionality of support of demonize mode.
  • Added DRCE new stat data in task state response.
  • Fixed several bugs of DRCE functional object.
  • Added PHP API additions to support new DRCE tests sets.
  • Added Python API additions to support new DRCE tests sets.
  • Complete updated the “Demo Test Suit” including Python applications services “Distributed Tasks Manager” and “Distributed Crawler”.
  • Added new API and applications for PHP and Python languages.
  • Complete updated integration and deployment for Debian and Centos OS.
  • and many more…

Distributed Crawler Service

Main requirements specification, phase A – 2014-01-26 finished; phase B – 2015-01-01 started


Characterization


The Distributed Crawler Application (DC) application is common purpose service class software. The main functional goal is to provide possibilities for users to fetch data from data sources and to create huge collections of resources. Basic features include the web-crawling algorithms implementation with standard (web http-based) or custom resource fetcher. DC has developed as a scalable & distributed Web Crawling Service for automated data crawling, data extraction to provide the possibility for information integration from various websites.

This web crawling and data scraping technology can be used to weed out the relevant information as well as build business intelligence. Whatever any kind customized solutions can be done with flexible configuration and parameters tuning. The web crawling engine is also capable of culling relevant information that is several links away from the start set, while effectively eliminating many irrelevant pages and scan web-sites structure efficient way. The frequency of queries to web-sites can also be defined by the client as hourly, daily, weekly, monthly or another more complex way as well as re-crawling schedule.

The DC web data crawling and tags extraction service can to help to convert useless data into structured and useful content. The entire process of crawling, scraping, data collection and sorting are automated. The clean and structured data received from the DC service can be immediately used for decision making solutions and algorithms of target projects.

The service based on Distributed Tasks Manager (DTM) and implements applied crawling algorithms and architecture as distributed tasks doing batch processing in isolated OS processes. Additionally provided interface for extended post-crawling content processing like scrapping, NLP, statistical analysis and so on.

The main features list:

  • http links collections,
  • resources collections and distributed storage,
  • distributed data fetcher IPs,
  • planned and managed crawling http requests frequency,
  • custom data fetchers, request protocols, resources formats,
  • free scalability and hot changes of productivity,
  • different model of resources sharding,
  • parameters templates and inheritance,
  • customizable target data storage, including native file system, key-value DB, SQL BD and other,
  • unified data processing including the scraping algorithms for news articles tags detection,
  • multi-host, multi-task parallel crawling and processing,
  • durability and fail-safe principles including replication with redundancy of of local host’s DB schemas and data.

Conditions


Standalone boxed application that works as a client-side top user level of DTM application server.

Usage Domain


Applied by developers and system integrators in target projects as server-side software and tools set. Most common purposes:

  • Distributed asynchronous parallel web sites crawling.
  • Distributed synchronous real-time web pages crawling and scraping.
  • Distributed raw web resources data storage management.
  • Distributed URLs database storage management.
  • Distributed asynchronous parallel post-crawling processing including the tags scraping.

Technology


Single process, multi-threaded, Python language application implementation, integrated with DTM application server by HCE Python API bindings.

Object model


Threaded control objects, MOM-based networking, ZMQ tcp and inproc sockets, messages communications, messages queues, json serialization protocol.

Functionality


Process client requests, managed automated web-sites crawling, post-crawling processing, real-time crawling+processing (see detailed protocol specification for the real-time gateway API) and resource management.

Philosophy


Asynchronous multi-host multi-threaded mutexless messages handling, parallel computations, asynchronous distributed remote tasks processing, automated managed batch processing, distributed resources management.

Architecture


Process interactions uses ZMQ TCP sockets connections server and client type. In process interactions uses ZMQ inproc sockets connections servers and clients. Asynchronous inproc resources access as well as requests processing provided by MOM-based transport provided by ZMQ sockets technology. No system or POSIX access controlling objects like mutexes or semaphores used. The only one kind of processing item is message. The several messages containers types like queues, dictionaries, lists and so on can be used to accumulate and organize processing sequences. The key-value DB engine is SQLite.

There are two listened by DC service TCP ports:

  1. Administration.
  2. Client.

Administration – handles requests from tool client applications. Requests of that type fetches statistical information from all threading objects as well as can be used to tune some configurations settings of DC service directly at run-time period.

Client – handles requests from client side API or tool application. Requests of that type are main functional queries for any applied operation and statistical data collection including the Site and URL management CRUD as well as real-time crawling. More detailed description see in documentation for the client application.

All requests are represented by json format of message. The structure of requests and main tasks logic principles are separated from concrete execution environment. This gives potential possibility to use some several execution environments engines, but not only HCE DRCE cluster.

More detailed description of usage of service and client modules see in main documentation.

Object model


All active networking usage objects (blue primitives on architecture UML diagram) are based on threaded class object. Also, all threaded objects uses list of transport level items of two types: client and server. Both are based on ZMQ sockets, server type can be TCP or inproc. TCP used for external connections, inproc – for all internal inter-threading events interactions
DC service architecture

Site


The structural unit that represents crawling item from user side. Has properties applied for each URL fetched from page of this site.

Resource


The structural unit that represents results of HTTP request downloaded from site by URL. Mainly it is http resource like html page, image or any kind of MIME type content.

URL


The structural unit that represents the resource URL for the site. Used as base of main resource identifier for md5 checksum calculation.

HTTP Request


The object that used to do HTTP querying and resources downloading algorithms and operations on data nodes.

HTTP Response


The object that used to represent and to parse downloaded resources on data nodes.

Client interface service


This class accepts the client requests events from TCP connection and sends them to the proper target threading class. This class works mostly as a proxy between the target functional threaded class and clients. It connects to three target threaded classes as shown on application architecture schema.

Batch Tasks Manager


It is a main class that implements algorithms of continues crawling (optionally and processing) iteration, interacts with DTM service, sets crawling tasks to execute and checks state of that tasks periodically. To start the crawling task it collects some URLs from SitesManager and creates the crawling task Batch. The crawling task batch send as main data set and input data of the main crawling application that works on target data node in the HCE DRCE Cluster as asynchronous tasks.

Batch Tasks Manager Process


It is a main class that implements processing iteration, interacts with DTM service, sets processing tasks to execute and checks state of that tasks periodically. To start the crawling task it uses simple scheduling. The process task batch send as URLFetch DB-task request, collects resources ready to be processed, converts list of them to the Batch object and starts processor-task that includes the scraper-task and scraping applied algorithms. All tasks applications works on target data node in the HCE DRCE Cluster as asynchronous tasks.

Sites manager


The main client interface for Site and URL objects operations, also performs periodical Re-crawling and Aging actions using the DRCE shard cluster directly in multicast mode.

The Crawler application


The application that acts as web-crawler, uses crawling batch as a main job order, executes HTTP requests and stores resources in the local file system cache, updates state of resources in the local SQL DB. Located and acts on data node.

Processor application


This application represents container and manager for applied processing modules like the scraper application. Located and acts on data node. This is main an after crawling data processor business logic and applied algorithms API.

Scraper application


This application represents sets of scraping algorithms that can be used to process locally stored data. The results of processing  Process located and acts on data node.

DB application


The application that acts as a main interface with DTM application to distributed DB units. The DB units manage the local databases of all objects and items defined on local data node level. Also, this application fetches locally stored resources. Located and acts on data node. Detailed information about the DB schema can be obtained from DB main documentation.

Distributed Tasks Manager Application

Main requirements specification, phase A, 2014-01-18


Characterization


The Distributed Tasks Manager Application (DTM) application is common purpose service class software. The main functional goal is to provide possibilities for users to manage remote tasks execution and computational resources in the HCE DRCE cluster execution environment.

General features:

  • Tasks management.
  • Resources management.
  • Execution environment management.

Conditions


Standalone boxed application that works as a client-side top user level of HCE’s DRCE cluster server.

Usage Domain


Applied by developers and system integrators in target projects as server-side software. Most common purposes:

  • Scheduling tasks to be executed at particular time and/or execution environment load optimization.
  • Distributed asynchronous parallel tasks execution and data processing.
  • Handling long and heavy job tasks like file format conversions (video, images, documents, etc).
  • Offloading heavy backend jobs.
  • Support any kind of executable that accepted by hosts platform.
  • Load-balancing data processing algorithms.
  • Failover data processing solutions.
  • Distributed data close to code solutions.

Technology


Single process, multithreaded, Python language application implementation, integrated with HCE DRCE cluster server by HCE Python API bindings.

Architecture


Application has multi-threaded architecture with asynchronous MOM-based inproc transport based on ZMQ functionality.
DTM_application_architecture
It is a server software class Linux daemon technology. It listens three ports to interact with user client application interface, admin user interface for management and Execution Environment (DRCE Cluster) – for callback tasks state notification handler. The internal containers for various regular data storage based on sqlite backend.

Object model


Threaded control objects, MOM-based networking, ZMQ tcp and inproc sockets, messages communications, messages queues.
DTM_application_class

Functionality


Process client requests, tasks planning and scheduling, tasks management in DRCE cluster.

Philosophy


Asynchronous multithreaded mutexless messages handling, parallel computations, asynchronous distributed remote tasks processing.

Components and objects


Task


Task it is a regular executable artifact that can be supported by data nodes of a cluster. Task is an atomic execution unit that can be managed and controlled. Task identified by the DRCE API specification as request with specification of command to execute, data that can be provided with task request for processing (or got via any another task-specific API) as well as the way to retrieve processing results. Tasks can be selected and managed by criterions like: group Id, user Id, creation date, scheduled date, terminated date, termination status, estimated execution time, real execution time, and fetch results counter. Tasks can be synchronous and asynchronous.

Synchronous – executed by execution environment in sequential one-by-one mode. This mode supposes that task completed in one step after request and results returned immediately. No resource planning and scheduling is involved and data flow inside cluster competes with task’s computations for hardware resources like CPU, RAM and disk I/O. These tasks are typically short, a request encapsulates command (possible with program code or binary executable) and small size input data. Responses are contains processing results that possible can be reduced inside execution environment. The request can be timed out. In case of timeout is too small, results can be lost. Most effective cluster resources utilization can be reached with usage small request messages size and multi-client requester model. Possible direct reflection of external, for example web requests, to task execution requests to get scalable architecture for high loaded web-sites.

Asynchronous – executed by execution environment in scheduled lazy mode. This mode supposes that computational environment using execution environment resources load level controlling and resources usage planning strategies as well as tasks scheduling. Task that was set by user is not started inside execution environment right after it was created. The computational environment tasks manager checks the time that was requested by user as best for user’s application business logic (possible nearest in time or ASAP, or in range of dates interval). To make the algorithm of prediction of task timing more effective, user can to specify estimated execution time of task and POSIX threads number that task potentially can to utilize. If schedule has a place (at least – the number of timeslots that equal or greater than estimated execution time) for a task it will be set and take a free place in size of predicted resources (execution time, number of POSIX threads, amount of RAM, amount of disk space and so on). If no place for the tasks, the tasks manager can to return the error and finish user request on task creation or to try to choose another time slot(s) according with strategy that was defined by create task request parameters for this kind of situation (for example ASAP for time, best for free resources (CPU, for example) and so on). After task was scheduled the task manager using clocking, time slots and information about the current execution environment state (execution environment average load level and another resources property values) starts tasks that are set for a correspondent time slots. Tasks scheduler can to change position of the task or to skip and cancel it if some wrong state of execution environment detected on the moment of the time slot reaches now state. So, depends on strategy, scheduler can act as real-time or continues postponed. Another key part of system that takes a place in a tasks execution process – it is a resource manager. Execution environment based on DRCE API configured to use hardware resources like CPU, RAM, DISK and so on. These resources located on each data host of the HCE cluster and monitored periodically to compute average usage level per each resource type. The current average values of resources state indicators are actual parameters that used by scheduler during planning and processing of time slots of schedule.

Tasks chains


In asynchronous mode tasks can be single unit or united in to the tasks chains. Chains are planned and represented in the schedule as one single task. Scheduler executes chains the same way as regular separated tasks, but with execution environment limitations. For example, all chains are executed on the same HCE node (and on the same physical host, as well). The stdout from previous task became stdin for next. Behavior of the node executor depends on strategy defined for each chain unit. For example, if some chain fault executor can to abort whole task or to continue execution of next chain. The results stored the same way for each chain separately, but can to be fetched in one get results request.

Tasks sequences


Both synchronous and asynchronous modes tasks can be set in schedule as independent and dependent. Independent supposes that task is executed according with the strategy at the specific time and execution environment load level. Dependent acts as a sequential after another task started, worked defined time, terminated or finished. So, schedules can be created not only using the time marks and execution environment load level conditions, but tasks sequence condition.

Tasks manager


This is object that receives tasks as atomic units from user client, store task’s data in the tasks data storage, set task to the tasks scheduler object and receives information about the task state from tasks state update service, execution environment service, and tasks executor. Tasks manager implements main algorithms that used to handle and manage of tasks state, set tasks to scheduler, cancel tasks, reschedule tasks, manage tasks sequences and so on.

Resource


Resource – it is a hardware or software unit of possibility or feature.

Typical hardware resources are CPU cores number, CPU load, RAM size, DISK size, I/O wait level, Network bandwidth level, Network connections number and so on.

The software resources can be represented as libraries calls, libraries instances number, modules loaded, services requests number, processes number, objects instances number and so on.

For HCE cluster running in load balancing mode DRCE manager uses resources of all nodes in competitor mode. This mode supposes average spreading of resources on all tasks’ processes proportional way. But practically, the possibility to spread resources depends on OS state, hardware architecture and tasks specific conditions like artifact execution mode and artifact type.

Resource manager


It is an object that holds resources list and manage resources properties information, process messages from resource state monitor object and from the scheduler. Resource manager implements algorithms of resources operation and state controlling.

Artifact


Artifact or task’s artifact – it is unit that is used to do some algorithmic job on a target host system and takes resources. Artifact spawned by tasks executor of HCE node that is a part of DRCE subsystem. Artifacts can be classified on types. One of classification based on execution way. It can be machine binary code in form of compiled native CPU instructions for concrete hardware platform, or p-code of some virtual machine like JVM, or human readable source code for just-in-time or interpreter real-time execution including the shell script scenarios. Regardless of type, artifact used as cli command and Unix-like cli interface with arguments, stdin, stdout and stderr file streams. Universal input-output protocol specification for DRCE task is only one limitation for artifact to get the link with algorithm encapsulated inside, data to process and processing results.

Task chain


It is a set of tasks that is united by planning scheduler process, execution environment location and results fetching way. The main differences of tasks that set in chain from single tasks it is that tasks united in chain will be executed sequentially on the same physical host by one hce-node DRCE functional object handler. Tasks that are united in chain have none zero parent Id and set to the DRCE cluster in one request.

Execution environment


The execution environment is represented by the regular HCE cluster with usage of main DRCE functionality. The manager nodes are in balancing replica mode. Main goal of usage this mode it is a parallel competition of data node hosts and handlers of nodes at one host in case of multi-core CPUs. The task need to be fully compatible with execution environment unit configuration, for example, correspondent architecture and executable need to be supported by OS for binary execution and run-time environment like JVM/JRE for Java or PHP, Python, Ruby and so on need to be installed and configured with libraries to be capable to execute tasks code.

Execution environment service


It is a HCE DRCE cluster router that represents the cluster’s entry point. The DTM application instance can connect and work with many clusters as well as one cluster can be used by many instances of DTM. Depends on scalability or durability principles the proportion can be one to one, and one to many in recombination. The execution environment service plays the server role and DTM application – the client role. The service represents black-box functional unit with complete automated algorithms and dedicated management tools that is a part of HCE.

Execution environment manager


It is an object that interacts with the execution environment service, makes a DRCE requests and process responses, process requests from the client interface service and tasks executor as well as query the task manager to update a tasks state. It works as a broker between tasks executor and execution environment service to make interaction asynchronous.

Planning strategies


This is a set of algorithms that used to assign tasks to the time slots. Those algorithms define principles and conditions for optimizations for execution environment state as well as for tasks execution sequence and so on. Depends on target user’s aims the behavior of load-balancing of resources and effectiveness of tasks execution can be changed and tuned up.

Tasks scheduling


It is a process of assigning the tasks to time slots in the schedule. This process acts as planning strategy and can go on demand when new task is got from user client or periodically.

Tasks scheduler or just Scheduler


It is an object that holds the schedule and process assignment of tasks for time slots as well as other basic operations with time slots like movements of past time slots from planned to log, change state and so on. Scheduler processes requests messages from the task manager and tasks executor and query the resource manager to update resources load level and amount value.

Data node


It is an HCE DRCE cluster node that is instantiates the DRCE Functional Object. This is down level of cluster hierarchy and hold executor of tasks as well as resources and tasks state notify client.

POSIX thread


This is a regular thread object in terms of target physical host OS platform. It is a low level execution unit for a machine code that is used by OS scheduler to manage CPU and RAM resources. Each CPU kernel executes some code that is represented by one POSIX thread at time. One OS process can to create more than one POSIX thread and try to get more than one CPU kernel to execute parts of own code simultaneously. The number of POSIX threads that process instance (task command from DRCE tasks point of view) can to create is important for tasks planning and scheduling process because reflects the predictable load level and physical resources usage for the process and the task during execution.

Tasks data storage


This is a data storage that used to store the data that was specified with the task and need to be sending to the execution environment. It can be a single-host location regular file system, SQL and NOSQL database, and so on. Depends on tasks specific properties like size of the data, data location it can be single-host and distributed with some scalability principles.

Tasks state update service


It is an object that holds ZMQ protocol based server. It accepts requests for update of tasks state directly from execution environment data nodes and queries the task manager with update information about tasks state. It works as a broker between task manager and execution environment to make the update tasks state process asynchronous.

Tasks executor


It is an object that implements main tasks execution cycle timing interacts with the scheduler to fetch tasks for time slots and send them to the execution environment manager as well us queries the tasks manager to update tasks state. It works as a main clock processor.

Resource state monitor


It is an object that does monitoring of execution environment resources state and updates resources properties by query the resource manager. It works as an execution environment resources watchdog. Potentially, can be extended with functionality of the execution environment resources manager.

Client interface service


It is an object that accepts client’s requests on task and interacts with execution environment manager and tasks manager. Depends on requested operation for task it can be directly forwarded to the execution environment or to the task manager. It works as a broker to make clients requests processing asynchronous.

HCE Demo Test Suit for PHP language

Demo Test Suit (DTS) based on end-user API bindings for PHP


This is readme.txt from DTS package archive hce-node-tests.zip.

Copyright (c) 2013 IOIX Ukraine, http://hierarchical-cluster-engine.com

Table of Contents


  • 1. Introduction
    • 1.1. About the demo set and test suit
    • 1.2. Hierarchical Cluster Engine (HCE) usage and demo set
      • 1.2.1. General description of cluster data modes and structure
      • 1.2.2. Cluster start and stop
      • 1.2.3. Cluster diagnostic tools
    • 1.3. Hierarchical Cluster Engine (HCE) usage and test suit
      • 1.3.1. Localhost 1-1-2 cluster complex functional tests
      • 1.3.2. Localhost 1-1-2 cluster Sphinx search tests
      • 1.3.3. Localhost 1-1-2 cluster DRCE exec tests
  • 2. Installation
    • 2.1. First time installation
    • 2.2. Upgrade
    • 2.3. Deinstallation and cleanup
  • 3. Usage
    • 3.1. Cluster structure models
    • 3.2. Spinx indexes and data schema
    • 3.3. Cluster start and shutdown
    • 3.4. Cluster state and management
    • 3.5. Test suit for Sphinx indexation and search
      • 3.5.1. Functional test ft01 – replica data nodes mode
      • 3.5.2. Functional test ft02 – replica data nodes mode
      • 3.5.3. Functional test ft02 – shard data nodes mode

Chapter 1. Introduction


Table of Contents


  • 1.1. About the demo set and test suit
  • 1.2. Hierarchical Cluster Engine (HCE) usage and demo set
    • 1.2.1. General description of cluster data modes and structure
    • 1.2.2. Cluster start and stop
    • 1.2.3. Cluster diagnostic tools
  • 1.3. Hierarchical Cluster Engine (HCE) usage and test suit
    • 1.3.1. Localhost 1-1-2 cluster complex functional tests
    • 1.3.2. Localhost 1-1-2 cluster Sphinx search tests
    • 1.3.3. Localhost 1-1-2 cluster DRCE exec tests

1.1. About the demo set and test suit


The demo set and test suit for PHP language – it is mix of bash scripts, php scripts with usage of php API for HCE projct and some data that was prepared for tests. The main aim it is to give simple easy and light way to try the HCE functionality, construct and up simple network cluster, test it on productivity and stability reasons on single localhost server configuration.

The demo mode can be used to check common usage form and configuration settings as well as to try to play with network- and CPU- dependent parameters.

Directories structure:

  • /api/php/bin/   – php utilities, executable php scripts for bash environment
  • /api/php/cfg/   – bash include configuration definitions for tests sets
  • /api/php/data/  – data files for Sphinx indexation and another data for test suit
  • /api/php/doc/   – documentation
  • /api/php/inc/   – PHP language API includes, used by php utilities and external interfaces
  • /api/php/ini/   – ini files for nodes
  • /api/php/log/   – demo test suit run-time logs
  • /api/php/manage/ – manage bash scripts to start, stop cluster and more
  • /api/php/tests/ – demo test suit bash scripts, main executable parts for different structure clusters functional operations
  • /data/          – index data directory for Sphinx search indexes representation
  • /etc/           – configuration templates and related files for Sphinx search functionality
  • /log/           – logs directory of Sphinx searchd process instances
  • /run/           – pid directory of Sphinx searchd process instances

1.2. Hierarchical Cluster Engine (HCE) usage and demo set


1.2.1 General description of cluster data modes and structure


The hce-node application can be tested on demo set pre-configured simple cluster for one physical host server. This pre-configured set of settings, configuration settings and parameters are provided by this demo test suit archive.

The demo set defines cluster basic architecture 1-1-2-x. This means one router, one data (shard or replica) manager, two Sphinx index manage data (shard or replica) nodes in cluster:

[router node]
       |
[data manager node]
      /            \
[data node 1] [data node 2] [data node 3] [data node 4]

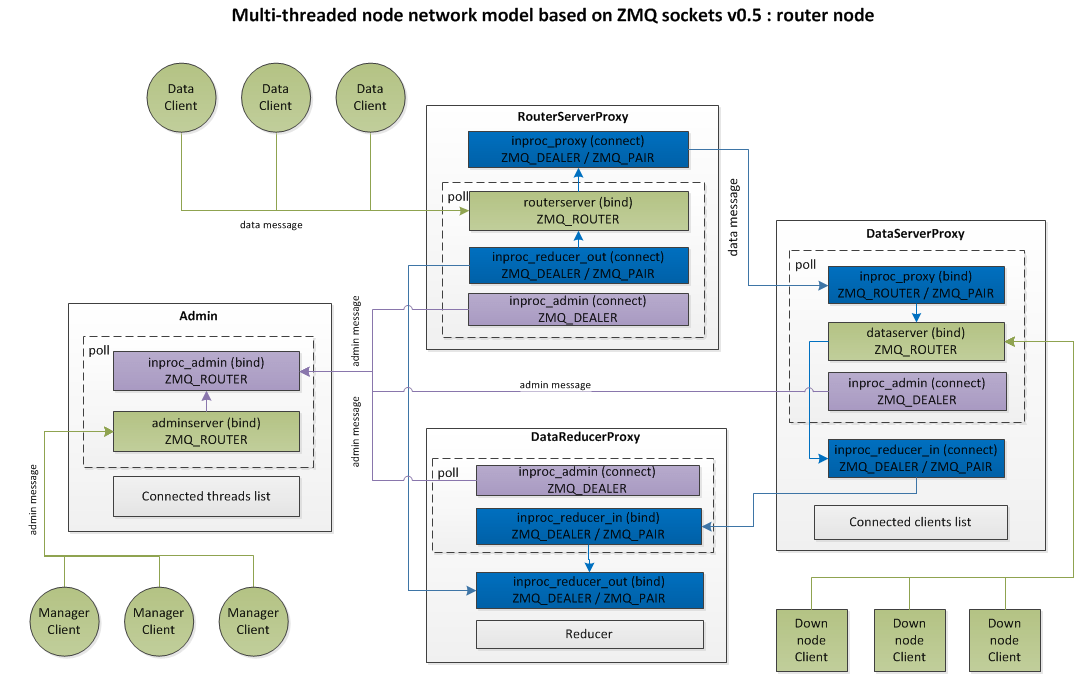
The cluster entry point is a roter node. It uses zmq API to receive client connections and requests. It acts as a service with internal network protocol. Many clients can connect to the router and make requests simultaneously.

The 1-1-2 structure can be used to simulate two types of data node sharding model – proportional and replication.

The proportional type supposes sharding between two nodes and unique set of document index for Sphinx search engine. This type also supposes multicast mode of requests dispatching for two data nodes. This is simulation of cluster unit for huge index that nedd to be split on several parts. The search messages processing for one request handled in parallel mode. Manager node collects results from all nodes and do reducing task. Reducing task for Sphinx search includes merging, sort and duplicates removing. Unique results returned as a response to the router node.

The replication type supposes mirroring of data between two nodes and complete duplication of data. This type supposes round-robin or cyclic executive requests dispatching between of two data nodes. In this case the manager node do the same job as for proportional type, but number of responses collected is always one.

To switch between this two principal modes the configuration parameter “MANAGER_MODE” can be set as “smanager” or “rmanager” value in the

~/hce-node-tests/api/php/cfg/c112_cfg.sh

After type of data node sharding model was changed cluster needs to be restarted.

1.2.2 Cluster start and stop


After installation of hce-node package the main executable application is ready to use, but needs to get correct parameters to sturt and construct proper cluster tructure. The demo test suit contains complete set of bash scripts to manage it. They are located in the /manage directory:

  • c112_localhost_start_all.sh   – start cluster at localhost
  • c112_localhost_stop_all.sh    – stop cluster at localhost

After cluster started once it runs several instances of hce-node application. For localhost 1-1-2 cluster it is four instances. Total number of instances at some period of time depends on cluster structural schema and state.

After start script finished the state of each nodes can be checked by logs located at the:

~/hce-node-tests/api/php/log/n***.log

directory. The 1-1-2 cluster’s nodes named as:

  • n000 – router
  • n010 – manager (shard or replica)
  • n011 – data node admin 1
  • n012 – data node admin 2
  • n013 – data node searcher 1
  • n014 – data node searcher 2

In case of all is okay with TCP and all required TCP ports are available to use – the log file contains information about binding and connection as well as periodical statistics of main indicators of node activity.

The TCP ports that is used for cluster architecture building defined in the configuration file for corresponded cluster structure schema, for example, for 1-1-2:

~/hce-node-tests/api/php/cfg/c112_localhost_cfg.sh

The list of LAN ports are separated on three types:

  • Router ports: ROUTER_SERVER_PORT, ROUTER_ADMIN_PORT and ROUTER_CLIENT_PORT
  • Shard/replica manager node(s) ports: SHARD_MANAGER_ADMIN_PORT and SHARD_MANAGER_SERVER_PORT
  • Replica node(s) ports: REPLICAS_MANAGE_ADMIN_PORTS and REPLICAS_POOL_ADMIN_PORTS

The replica node admin ports separated on the manage and pool ports. Manage ports used for data index management comand like Sphinx index commands and general nodes management. Pool ports used to manage the searchers or load-balancing nodes pool state verification and management.

The cluster stop script sends shutdown command to all nodes via admin port, but not wait on shutdown finish. Current cluster state can be verified by any diagnostic tool script.

By default cluster 1-1-2 configured to have six nodes. See the 1.2.3 chart schema diagnostic tool.

After all Demo Test Suit dependencies for PHP language installed and configured proper way (please, see dependencies components installation manual at main site documentation secton:

http://hierarchical-cluster-engine.com/install/

“Install Demo Test Suit Environment for PHP language” cluster can be started by start all components script:

cd ~/hce-node-tests/api/php/manage/
./c112_localhost_start_all.sh

Before nodes instances started the log directory cleaned from logs of previous start and all in memory node processed killed by name.

Started cluster can be stopped by stop all components script:

./c112_localhost_stop_all.sh

The stop script calls shutdown command for each node and starts diagnostic script tool c112_localhost_status.sh. Each node instance starts hce-node process and uses from one to three ports depends on role. After successful cluster stop all nodes instances shutdown and ports are freed.

Some parts of cluster can be started and shutdowned separatedly to get a possibility to manage them during the cluster session. This can be used to do some tests and demo simulation of state of some cluster nodes in router role, shard manager or replica. The dedicated manage start scripts are:

c112_localhost_start_replicas_manage.sh
c112_localhost_start_replicas_pool.sh
c112_localhost_start_replicas.sh
c112_localhost_start_router.sh
c112_localhost_start_shard_manager.sh

and stop scripts are:

c112_localhost_stop_replicas.sh
c112_localhost_stop_router.sh
c112_localhost_stop_shard_manager.sh

To get more detailed start/stop management please see the manual for PHP utility manager.php.

1.2.3. Cluster diagnostic tools


The demo test suit includes several diagnostic tools:

  • c112_localhost_loglevel.sh     – get and set log level of all nodes
  • c112_localhost_manager_mode.sh – get or set the shard manager node mode
  • c112_localhost_properties.sh   – get properties of all handlers of all nodes
  • c112_localhost_schema_chart.sh – get cluster schema in ASCII text chart format
  • c112_localhost_schema_json.sh  – get cluster schema in json format
  • c112_localhost_status.sh       – check status of all nodes instances processes

This tool scripts can be used to get some additional information at run-time period.

The logging of information of node state and messages processing can be done in three levels:

  • 0 – minimal, includes only initialization and periodical statistical information.
  • 1 – middle, includes also the requests data contexts as well as additional information about handlers state.
  • 2 – maximal, includes also complete data of all messages fields and state, as well as additional information about functional objects state, like Sphinx Search Functional Object.

The properties information – it is handler’s specific fields values. Each field can be information or state. State fields can be changed by additional API calls. Many state fields like TCP ports, data mode, logging level and so on can be changed by dedicated API and manager commands at runtime. The properties information can be used for diagnostic and tracking purposes.

The cluster schema – it is structural relations between all nodes that detected at run time. It can be used to construct, check, verify and log the cluster structure. In future this information can be used to restore structure after some faults, to create mirrors and so on. The ASCII chart schema for default cluster configuration looks like:

n000
router
localhost
A[*:5546]
S[*:5557]
C[*:5556]
  |
n010
rmanager
localhost
A[*:5549]
S[*:5558]
C[localhost:5557]
         |
____________________
|                  |
n013               n014
replica            replica
localhost          localhost
A[*:5530]          A[*:5531]
C[localhost:5558]  C[localhost:5558]

n011       n012
replica    replica
localhost  localhost
A[*:5540]  A[*:5541]

First line of each node item – it is node name.

Second line – node mode.

Third line – the host of scanned admin port, for LAN cluster version if diagnostic tool used at the same OS shell session it is always “localhost”. Next lines A[], S[] and C[] – represents Admin, Server and Client connection ports used to listen to or to connect to depends on the node role.

In the example displayed above, all nodes instances in all roles uses the Admin port 5546, 5549, 5530, 5531, 5540 and 5541 to listen on manager connection and admin commands requests like manage, diagnostic or administration of node or Sphinx index. But S[] and C[] connection ports used in different way depends on roles.

The router node uses S[] port 5557 – to listen on rmanager node connection and C[] port 5556 – to listen on manager connection and data command requests like Sphinx search or DRCE exec. So node in router mode uses all three ports to bind and to listen on connection.

The rmanager node uses S[] connection port to listen on replica node connection and the C[] connection port – to connect to router node.

The replica node from pool set uses C[] connection port to connect to the rmanager or smanager node. The replica from admin manage set does not use any connectin ports but only A[].

So, connection ports S[] and C[] used to create and to hold the cluster structure. The A[] connection ports used for management and diagnostic.

The status information tool c112_localhost_status.sh gets only “Admin” handler’s fields. This is bit faster than all handlers fields in properties information check. This information tool can be used to fast check nodes state, for example, after start, shutdown, test set finish or some another reasons.

Complete nodes handlers run-time properties can be fetched by the c112_localhost_properties.sh script. It get all handlers data from all cluster nodes and store them in json forma in the log file. This log file can be used to get some property by one for tracking toollike Zabbix (c) system. For this purpose the fetcher tool named zabbix_fetch_indicator.php included. Test script to check is the fetcher worked also provided – zabbix_fetch_indicator.sh. It fetches the value of “requestsTotal” property indicator of Admin handler from node localhost:5541.

Any diagnostic tool script can be started in any time without command line arguments. Information displayed on console output or stored in the correspondent log file in the ~hce-node-tests/api/php/log/ directory.

1.3. Hierarchical Cluster Engine (HCE) usage and test suit


1.3.1. Localhost 1-1-2 cluster complex functional tests


The demo tests suit set contains several minimal functional tests sets to get check of cluster functionality, productivity on concrete hardware platform, Sphinx search tasks usage, API tests and usage checks and so on.

The functional tests combined in to the complete sequential actions that reflects of typical usage of distributed data processing like documents indexation and search, as well as administrative commands and dignostic tools.

Test suit contains functional tests sets that located in the:

~/hce-node-tests/api/php/tests/*ft*.sh

files.

The *ft01*.sh test – it is complete life time simulation of the Sphinx search cluster with replicated data nodes. Replication model is fully mirrored. So, independently on the manager mode (shard or replica) this test will fill both data nodes with the same documents. This is important to understand the search results and productivity values. The correspondent mode of data nodes manager for this test is “replica manager”.

The life cycle of “ft01” includes execution of operations:

  • create new index,
  • fill index with branches document source files,
  • fill index with schema,
  • rebuild Sphinx indexes of all branches,
  • merge all branches indexes to the trunk index,
  • start index usage for Sphinx search,
  • full text search tests,
  • state diagnostic

And after testing cleanup actions like:

  • stop index usage,
  • remove index (including all data files and directories that was created)

After cluster was started – the “ft01” test suit unit can be started by execution of the corresponded bash script, for example, for 1-1-2 cluster it is the:

~/hce-node-tests/api/php/tests/c112_localhost_ft01.sh

After finish the execution logs can be checked. Logs are located in the:

~/hce-node-tests/api/php/log/c112_localhost_ft01.sh.log

After tests was done, any diagnostic tools or search tests can be started. When all kind of tests or another actions finished, to cleanup the indexes data from disk and to set cluster in initial state the ft01 cleanup script need to be executed once, for example, for 1-1-2 localhost cluster:

~/hce-node-tests/api/php/log/c112_localhost_ft01_cleanup.sh

As well as for test suit unit results, cleanup execution results can be checked in logs:

~/hce-node-tests/api/php/log/c112_localhost_ft01_cleanup.log

The *ft02*.sh test – it is complete life time simulation of the Sphinx search cluster with fillng the data node indexes from data source directory and supports shard and replication data mode. The sharding method depends on how the cluster was started or what data mode used or manager node. If manager node uses shard mode – smanager, indexes will be filled sequentially, from one xml document file to another and all documents will be distributed between several indexes managed by own data node. If manager node uses replica mode – indexes will be filled with the same documents as complete mirrors for all data nodes. Another operations of “ft02” – the same as for “ft01”. After “ft02” finished, logs can be checked to get information about how each
stage was finis. The same way, after “ft02” was complete all kind of dagnostic or search can be executed. To cleanup the indexes data and return nodes back in to initial state the “ft02” cleanup script nedd to be executed.

After cleanup script executed, the data node became at initial state, no more indexes exists and search will always return empty results. Any another operations and commands for Sphinx search index will return error.

1.3.2. Localhost 1-1-2 cluster Sphinx search tests


The demo tests includes the Sphinx index search tests. This tests are two processing models – single-client and multi-client. The single-client uses one client connection to execute set of search requests. The searcher.php tool utility used to execute search, but several required parameters are set by bash script.
To execute set of searches in single-client mode, the script:

~/hce-node-tests/api/php/tests/c112_localhost_search_test.sh

can be executed. The search results located in the log file:

~/hce-node-tests/api/php/log/c112_localhost_search_test.sh.log

Different parameters like searched keyword, number of requests, number of results, filters and so on can be changed inside this bash script as: QUERY_STRING_DEFAULT, REQUESTS, RESULTS, LOG_LEVEL variables.

Multiple thread search can be started by:

~/hce-node-tests/api/php/tests/c112_localhost_search_test_multiclient.sh

Optional first parameter is searched string, default value is “for”.

Default clients number is 16, requests per client 1000, max. results per one search 10, log level 0. This settings defined in this file as variables:

QUERIES=1000
RESULTS=10
CLIENTS=16
TIMEOUT=5000
SEARCH_STRING="for"

and can be changed before run.

1.3.3. Localhost 1-1-2 cluster DRCE exec test #1


The demo tests for DRCE includes set of prepared requests in json format for different target execution environment (script programming languages, bash and binary executable).

If the request requires source code or binary executable – it is stored as separated file with the same name. It read and placed inside request json by macro definition “READ_FROM_FILE:”. If file is binary it need to be base64 encoded by set of highest bit in the “action” mask. Please see protocol specification doc DRCE_Functional_object_protocol.pdf.

Three types of demo test scripts provides possibility to execute some request in single thread (from one start to N iterations), execute all prepared requests sequentially and to execute one of prepared request in multiple threads parallel mode.

Set of prepared requests located in the:

~/hce-node-tests/api/php/data/c112_localhost_drce_ft01

directory. Each txt file contains prepared request in json format according with the DRCE specification: DRCE_Functional_object_protocol.pdf

Each of prepared request enumerated as suffix of .txt file and can be addressed by this number, for example file c112_localhost_drce_json00.txt can be addressed as request 00, c112_localhost_drce_json01a.txt – as 01a and so on.

After cluster started with default configuration in balanced mode (shard manager mode is “rmanager”) single prepared request, for example, “00” can be executed in single environment once by:

cd ~/hce-node-tests/api/php/tests/
./c112_localhost_drce_test.sh 00

Default log level is 4 (maximal) and log file with correspondent file name will be stored in the log directory – c112_localhost_drce_test.sh.log. In case of success execution complete response message structure debugged, including execution result stdout, execution time, and so on…

To execute all prepared requests use:

./c112_localhost_drce_test_all.sh

The execution time depends on power of hardware platform and OS environment settings. The log file c112_localhost_drce_test_all.sh.log will contain all tests responses in the same format as single.

To execute one prepared request several times to get productivity report for single thread parameter located in file c112_localhost_drce_test.sh

REQUESTS=1

need to be changed, for example as:

REQUESTS=100

to execute specified prepared request 100 times sequentially. The log level for multiple sequential execution can be set as 0. Parameter

LOG_LEVEL

To execute one prepared request by multiple clients, use:

./c112_localhost_drce_test_multiclient.sh 00

Default clients number 16, requests for each client 1000, log level 0. This will start 16 process of DRCE client utility drce.php. The execution state can be evaluated by cluster properties statistics, nodes logs and CPU utilization level. Each instance of drce.php creates own log file, for example, drce_client.1.log, drce_client.2.log and so on up to drce_client.16.log. Logs contains the same information as single thread result. Reqests number, clients number, timeout delay and the log level can be set by variables:

QUERIES=1000
CLIENTS=16
TIMEOUT=5000
LOG_LEVEL=0

This test can be used to evaluate the platform power and possibility to process some parallel tasks by target execution engine.

1.3.4. Localhost 1-1-2 cluster DRCE exec test #2


This test set is list of algorithms taken from the project: http://benchmarksgame.alioth.debian.org/

Languages covered:

  • C
  • C++
  • PHP
  • Python
  • Ruby
  • Perl
  • Java

Algorithms list:

  • binarytrees

Dependencies:
BC Math:

sudo apt-get install bc
~\hce_hce-node-tests\api\php\data\c112_localhost_drce_ft02\binarytrees.gcc-7.c

Require the libapr1-dev package that can be installed by:

sudo apt-get install libapr1-dev
~\hce_hce-node-tests\api\php\data\c112_localhost_drce_ft02\pidigits.c
sudo apt-get install libgmp-dev
~\hce_hce-node-tests\api\php\data\c112_localhost_drce_ft02\pidigits.gpp-3.c++
sudo apt-get install libboost-dev
~\hce_hce-node-tests\api\php\data\c112_localhost_drce_ft02\pidigits.php-5.php
sudo apt-get install php5-gmp

Add extension=gmp.so in /etc/php/php.ini file.

~\hce_hce-node-tests\api\php\data\c112_localhost_drce_ft02\pidigits.python3-2.py
sudo apt-get install python-setuptools
sudo easy_install pip
sudo pip install virtualenv
sudo apt-get install python-dev
sudo apt-get install libmpfr-dev
sudo apt-get install libmpc-dev
sudo pip install gmpy2 --global-option=build_ext --global-option=-Ddir=/home/case/local
sudo apt-get install python-gmpy
~\hce_hce-node-tests\api\php\data\c112_localhost_drce_ft02\pidigits.perl-4.perl
sudo perl -MCPAN -e 'install Net::SSH::Perl'

to be continued…

HCE client APIs

Client API bindings


HCE core functionality represents server side technology that is accessible via specific network protocol that is specified and defined by ZMQ library that used as main transport under TCP networking.

Since HCE core networking router and admin ports of nodes requires ZMQ client to interact it need to be presented for development of the upper level end-user applications as well as for easy integration in to the target projects as service-like engine. For this purpose the client API bindings are projected to be developed for several languages like PHP, Python, Java, JavaScript and so on…

The ZMQ library provides binding for about 30 languages, so all this languages community can be covered by HCE Client API.

General API structure consists of three main layers:

  • Transport – implements main networking operations for router and admin network connections of node, message interchange, supports MOM as basic transport principles. This is low level API. Under alpha testing.
  • Application – implements various functionality and algorithms that covers main integrated and natural way supported subsystems like Sphinx Search, Sphinx Index Management, Distributed Remote Command Execution tasks management and nodes management. This is middle level API. Under development stage.
  • User – implements functionality, algorithms, service and cli and-user applications that can be used as top level interfaces and objects inside the target projects and as finished applications for management and administration. This is upper level API and utilities tools. Under design stage.

Each one can be used as separated dedicated API library and implemented as self sufficient modules for distribution and integration.

General layers structure represented on the schema below:
API primitives

Top level applications and end-user functional interfaces


On the ground of three level APIs several end-user functionality applications are planned to be implemented this year. This applications are first step of APIs binding integration in to the target projects or for creation stand-alone closed boxed services and sites for wide range of goals and solutions. There are four most important applications planned for building:

  • Distributed Crawler Manager – or just Distributed Crawler – this is application with REST and cli UI for complete life cycle of distribute web-crawling. Includes basic web-crawler features like fetching of web pages, extraction of URLs, manage URLs collections, storing resources in the custom defined and configured storage DB, managing of distributed crawling tasks, resources access, managing related attached properties and collections like parse templates and so on. This application based on Distributed Task Manager functionality and extends it with set of specific algorithms and data structures but utilize unified cluster-level APIs. This application oriented on farther resources processing on the same data nodes where they are crawled distributed way. First of all it is a Distributed Content Processor Manager application’s data. That conceptual approach aim is effective data distribution on stage of fetching from source and storage location on the same side as computational unit but distributed way. Such a solution can to help to avoid additional network traffic inside a cluster and between user access point and HCE system. The second positive feature that are provided by distributed crawling – it is multi IP-address crawling with proportional or more complex strategy of distribution of TCP IP connections from crawler to target web-server by crawler IP-address and timing. The problem of bots and robots blockade by IP-address and connection frequency level is most known for web-crawling task and solutions.
  • Distributed Content Processor Manager – this application also based on Distributed Tasks Manager and represents a collection of algorithms and libraries for wide are of text mining purpose united by common input/output specification for data flow and call API. This is end-user functionality application with REST and cli UI that provides the possibility to apply some one or several (linked in chains) computational algorithms to computation units like web-pages, resources, documents and so on. The basic goal – it is to provide  way to define and to run in planned (according with schedule) manner some vector of data processing procedures using step-by-step technology where output data from one algorithm became input data for another on the same cluster node. In distributed parallel solution such technique provides minimum time between steps as well as well host platform resources utilization. The unified protocol for data messages input-output interaction and interchange allows in easy way with minimal additional interfaces development – to extend the initial algorithms collection with custom libraries and modules. First collection will to contain set of Python libraries for text mining like HTML parsers, tokenization, data scrapping, NLP and so on.
  • Distributed Tasks Manager – this is a common purposes application that implements complete set of algorithms to create and to manage tasks that executed inside cluster environment according DRCE functionality. Tasks can be any kind of executable in source code form and formats as well as Java pre-compiled or even binary modules. The only one limitation – it is support of this kind of module by data nodes of a cluster. Scheduler with strategies of tasks time and resource utilization prediction will help to end-user to not to care about cluster overload or inopportune tasks execution. Data for calculations can be provided at stage of the task request with the message from user as well as located on data nodes (for example after web crawling) or on external data provider like external key-value DB. Results of computations also can to stay inside a cluster (at data nodes) until user will not delete them. Two basic tasks execution modes provided – synchronous and asynchronous. Synchronous – is simplest for user and supposes condition when source data as well as results are small and the goal of clusterization is in parallel of  computations and effective data delivery on target computing unit (physical host and cluster node). Most common usage of parallel computing mode in this case it is load-balancing and highly effective network infrastructure. Asynchronous – is complex and delayed in time. Scheduling, resource planning, resource and tasks state controlling, tasks management, results data access and so on algorithms and solutions are used to get a best results of optimization of usage set of physical hosts and distributed remote tasks execution.
  • Cluster Manager – this application is an administration tools set. It implements complete management support of nodes include all handlers and functional objects. Typical simple cluster management like state monitoring, statistical data tracking and more complex operations like schema management, nodes state and role controlling, data modes management, automation of attaching and detaching of new nodes, balancing controlling and many other. This application and user-level APIs based on application level APIs. Also, it implements some interfaces and solutions for cluster state indicators visualization as well as provides client interface for different management scenarios.

Under design stage.

PHP bindings


PHP bindings already implemented alpha in structural form and included in to the Bundle package archive. Complete structural model source code documentation available. Also, object oriented version under development at present time.

Transport level


The common object model for transport level can be represented by UMLs below:
API transport class
Sequence diagram illustrates common usage of transport for typical operations:
API transport sequence

Admin level


Admin bindings representation of objects model and dependencies on classes UML below:
API class admin
Also, one of possible algorithm of usage of admin API can be represented by sequence UML:
API sequence admin

User level


The second part of API that is under design stage for PHP language in OOP model it is “Cluster Manager Application” that is cli interface administration tool for complete management operations, as well as for building external service-like client side interfaces.

Now user level is under design stage.

Python bindings


Bindings for the Python language slightly differs by OOP model and implementation of library parts. It is because Python binding of ZMQ library differs from PHP and C++ and some language-specific principles and agreements are not exactly the same.

Transport layer


Common classes UML:
API transport classes
Sequence UML:
API transport sequence

Java bindings


Next stage implementation planned.

JavaScript bindings


Next stage implementation planned.

Hierarchical Cluster Engine (HCE) project – internal architecture

Introduction


This article shows main basic principles of general internal architecture and algorithms for newcomers to help to understand better the usability advantages and potential efficiency of HCE. For project architects, system integrators, general architecture design engineers, team leaders and technical management staff this information will help to understand better the possible place and role of HCE as engine and tool in the target project, to imagine the potential goals and possible to answer on several general questions about possible integration…

The HCE as engine has core architecture that represents main feature – to construct, build and hold network cluster infrastructure based on ZMQ PPP transport protocol that lays on TCP under Linux OS and is core on system-layer.

The HCE as framework has set API binding on user’s layer functionality. Common layers of architectural components can be represented as:
Architecture_general

Networking and threading


Cluster core implemented on POSIX multi-thread computation parallelism and distributed multi-host requests processing on MOM-based networking model.

Main cluster infrastructure based on different roles of nodes, separated data and admin requests handling by using two dedicated ports, asynchronous messages handling and processing based on ZMQ inproc sockets. Also is ready to be transactional and redundant.

The concrete internal threading architecture and messages routing model of HCE node instance depends on role is static and can be one of router, manager or data that is defined on start.

Messages routing of data requests messages for descent flows as well as messages collecting algorithm and reduce data processing for ascent flows depends on manager node mode – shard or replica.

Router mode


Cluster_node_router

Manager mode


Cluster_node_manager

Data mode


Cluster_node_data

Passive health checks


All kind of node roles instances doing the bidirectional heartbeating algorithm. There several types of behavior and parametrized cycling can be configured to make liveness and responsibility of nodes more strong and flexible. All timeouts and delays are configurable at start and run-time.

Dead Node Detection


If a node stops responding, it will be marked as dead for a configurable amount of time. The dead nodes will be temporarily removed from the load-balancing rotation on server node and client will enter in cycle of tries to re-connect to server node in case of it was marked as dead.


HCE-node application updated to v.1.1.1

Changelog:

Release 1.1.1 (2014-01-10)

  • Added DRCE new functionality of results reducer. Now shard mode supported additionally to replica (balanced).
  • Added Sphinx search custom ranker settings support for functional object.
  • Added PHP API additions to support new DRCE tests sets.
  • Fixed several bugs of DRCE and Sphinx search messages handling.

HCE and Distributed Remote Command Execution

General definitions


The Distributed Remote Command Execution (DRCE) functionality provides hce-node application clients with the possibility to execute Linux shell commands, to spawn process via pipe, and to interact with the spawned process by std input, output, error as well as by file. Flexible protocol defines custom way to interact with the process, to give him incoming data and to collect produced data. By this service handler integrated inside the hce-node application any kind of computational task can be executed remotely on the low level replica or shard nodes of the cluster hierarchy. Most typical way of possible usage of DRCE:

  • Execute data processing task, collect and fetch results from down replica or shard nodes according with cluster hierarchy.
  • Manage some Linux host systems remotely by group actions that can be spread wide on correspondent cluster infrastructure.
  • Spread some data to target cluster nodes for immediate or farther processing.
  • Fetch some data from many target host systems, like logs and collect them at client side.
  • Any kind of recombination of all above.

Main advantage of DRCE it is that structure of cluster for requests distribution, tasks execution planning, results collection and so on – can be custom defined and changed at run-time period.

Execution units can be connected at any time and extend power of processing pool. Also, execution units can be started on different physical servers and united in balance mode. It is very important to note that request message handling inside one unit is single-threaded, so no any mutexes or blocking as well as asynchronous request/response TCP sockets operation provided with ZMQ sockets library. On schema below simple DRCE computational cluster schema illustrate the connections direction and behavior of nodes in different roles:
1
Implementation of DRCE functionality in hce-node package includes client-side API for php language and client application to test and benchmark some algorithms and execution environment.

The Demo Test Suit includes set of prepared requests in json format that can be extended and changed manually. This set covers most important for hce-node execution environment like php and java, as well as provided with base Debian OS distributions like python, ruby and perl. Because very good affinity of hce-node application process instance and CPU kernel – the pool of hce-node replicas can to utilize CPU and I/O resources effective way provides up to 800 rps on one four kernel i5 physical server. On screenshot below the load level and by CPU kernel distribution shown.
2
As that can be seen above, for very short task that has execution time about 1 ms and 16 client threads – four computational units loads four CPU kernels in most effective way. Note, that in this test clients that requested tasks (drce.php application) and HCE cluster nodes instances located on the same physical host server. This is test #00 of Demo Tests Suit package of DRСE tests1.

The client application drce.php supports cli interface and provide usage of prepared jasons in many different tests and demos. Request and response protocols are very simple and formalized in json format. So, can be easy implemented on many other languages that are supported by ZMQ library.

The DRCE it is a second functionality after the Sphinx search that is natively supported by HCE.